Exporting data and changing the display
To access additional options, hover over a table or chart and select the 3 dots (...) in the top-right corner.
Using these options, you can:
- export data for further analysis
- view graph data in the table format
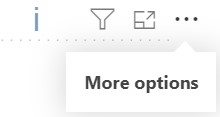
If a blue "i" icon appears, there is more data available than can be displayed on the graph. In this case, select Export data to download the full dataset, including data that cannot be shown in the graph or table.
You can also select Focus mode, located beside the 3 dots, to enlarge the chart and make it easier to view. This expands the chart to fill the available screen space.