Gisborne District Council rainfall data is displayed as hourly rainfall totals in millimetres (mm).
Each hourly rainfall total represents the rainfall recorded during the preceding hour. For example, a rainfall total shown at 10am includes all rainfall recorded between 9.01am and 10am.
For guides on using and downloading data, see tips for using the data below.
About the data
- The last 24 hours and last 7 day totals are hour aligned and total back - for example at 8:28am the data shows the previous 24 hours total to 8am, and the previous 7 days to 8am.
- All times are NZDT, they adjust for daylight savings when it’s in place.
- HBRC sites are run by Hawke's Bay Regional Council and this data's in raw format.
Tips for using environmental data
These pages display environmental data collected by Council monitoring staff and telemetry devices.
The technology we use allows data to be published as soon as it becomes available to us.
For the best experience, use a current version of Microsoft Edge, Firefox or Chrome. These pages are not supported in Internet Explorer.
Multiple reports on one webpage
Some pages contain multiple reports. Use the buttons at the bottom of the report to switch between report types.
![]()
Using dropdown menus
Most pages include a dropdown menu for selecting a monitoring site.
Your site selection will apply to all reports on that page.
Some pages also include a second dropdown menu for selecting a measurement type.
![]()
Selecting sites on the map
![]() You can select a site by clicking its location on the map. This selection applies only to the current report.
You can select a site by clicking its location on the map. This selection applies only to the current report.
To select multiple sites, hold down the Ctrl key while making additional selections. This can be done using either the map or the dropdown menu.
Viewing more information
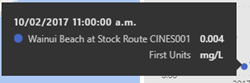
Hover over a site on the map to view additional information about that location.
Hover over a result on the map or chart to see the recorded measurement.
Exporting data and changing the display
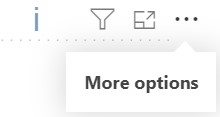
Hover over a chart and select the 3 dots (...) in the top-right corner to access additional options. From this menu you can:
- view graph data in a table format
- export data for further analysis
You can also select Focus mode, located beside the 3 dots, to enlarge the chart and make it easier to view.
If a blue "i" icon appears, there is more data than can be displayed in the graph. In this case, select Export data to download all available data, including information that cannot be shown in the graph or table.
More environmental monitoring maps and data
Rainfall
Hourly totals
River levels
River water levels and flows
River webcam
Waipaoa, Hikuwai and Waimata rivers
River level forecasts
Hikuwai, Taruheru, Te Arai, Waiapu, Waimata, Waipaoa
River low flows tool
Take status for active water take consent holders
Drought map
5 drought categories
Water situation report
Current and forecast rainfall, river flow data, groundwater data, drought status and a 3 month forecast
Soil temperature and moisture
Air quality
Particulate matter, relative humidity, air temperature, wind direction and speed
Weather stations
Air temperature, wind direction and speed, relative humidity
Freshwater ecology indexes
Macroinvertebrate, periphyton and deposited fine sediment
Swimming waters
Bacteria levels and water temperature
Rivers, streams and ground water quality
Time-series data
Groundwater levels
Measurements are in metres above sea level
Groundwater quality
A range of water quality parameters
Estuarine and freshwater quality
A range of water quality parameters
Coastal water quality
A range of water quality parameters