
Our Annual Report tells the story of how we performed in the 2022/23 financial year, the challenges we faced and how we're responding to them. This report covers the period from 1 July 2022 to 30 June 2023.
The report is an important tool for informing our communities about how we spent their rates. It also highlights the areas we performed well in, identifies areas for improvement and offers context for our future direction.
Included are the major projects and programmes and services we delivered. It contains a summary of the impacts multiple severe weather events had on our region this year, and the steps we have taken so far in our recovery response.
2022/23 Annual Report - Our Tairāwhiti
Some district highlights
July 2022
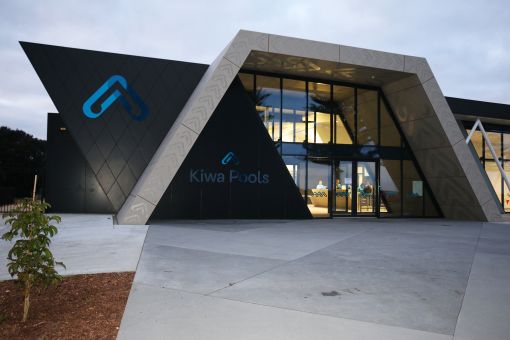
Kiwa Pools
Kiwa Pools was opened to the public on Saturday 2 September 2023.
The indoor pool facility was designed in collaboration with Ngāi Tāwhiri. The project was supported by $40m from the Government as part of its nationwide Infrastructure Reference Group (IRG) funding.
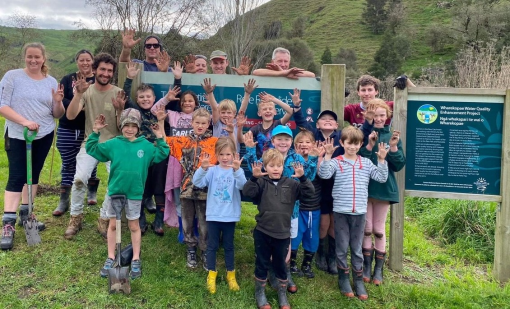
July 2022
Community planting day at Rere
1000 trees were planted to help protect against erosion sediment.
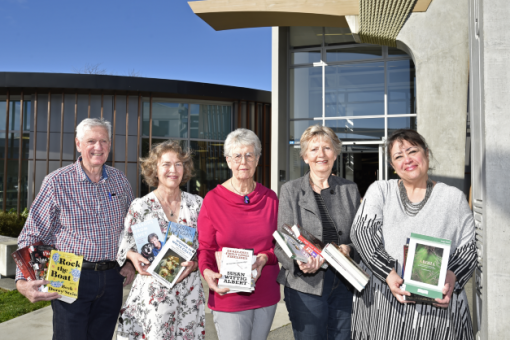
August 2022
100s of new books
Hundreds of new books were added to the large print collection in the library. Purchased with support from the HB Williams Memorial Library Book Trust.
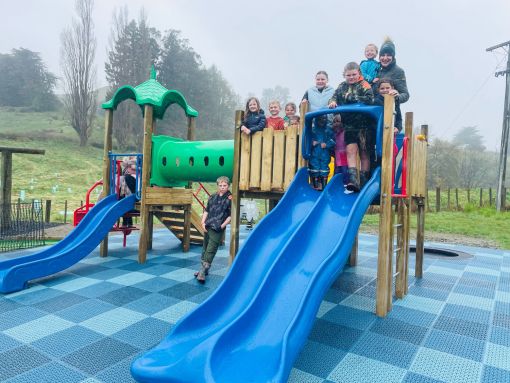
November 2022
New playgrounds
Tamariki and rangatahi are enjoying their newly completed playgrounds at Te Araroa and Tiniroto.
Photo is Tiniroto playground opening.
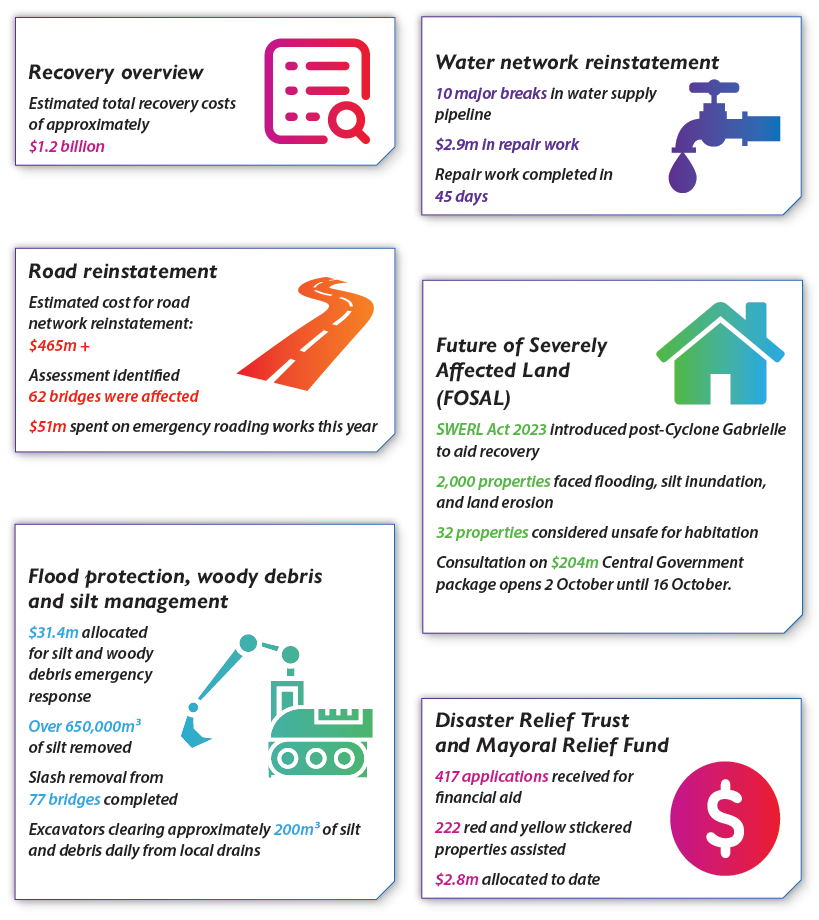
Our recovery highlights
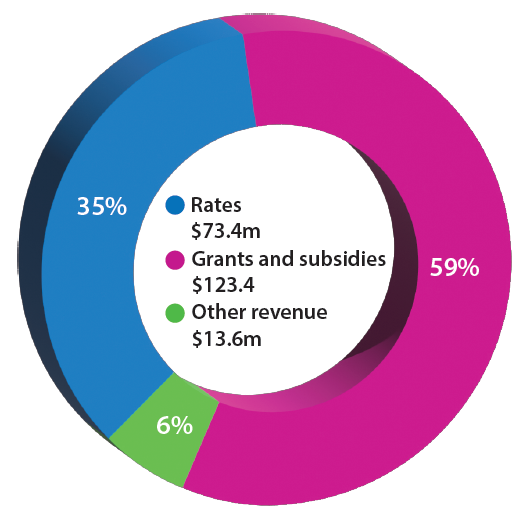
Finances at a glance
We received income of $210m compared to the budget of $148.2m.
Council expenditure
This includes the day-to-day costs necessary to run the organisation. Costs are to maintain, manage, develop and provide diverse services and facilities to the district.
The cost of Council doing its day-to-day business is driven by several factors including inflation, debt levels, salary and wages, inflation, amount of assets we own (and therefore must maintain) and whether Council increases or decreases the amount of services provided to the community.
As shown by the graph Roading, 4 Waters, Solid Waste and Environmental Services made up 75% of total operating expenditure of Council. The roading activity on its own represents 50% (or $95m) of the total costs. The total cost of all services was $191m.
